library(ggpubr)library(tidyverse)library(ecodados)spider <- Cap7_exercicio1t.test(Tamanho ~ Sexo, data = spider, var.equal =TRUE)
Two Sample t-test
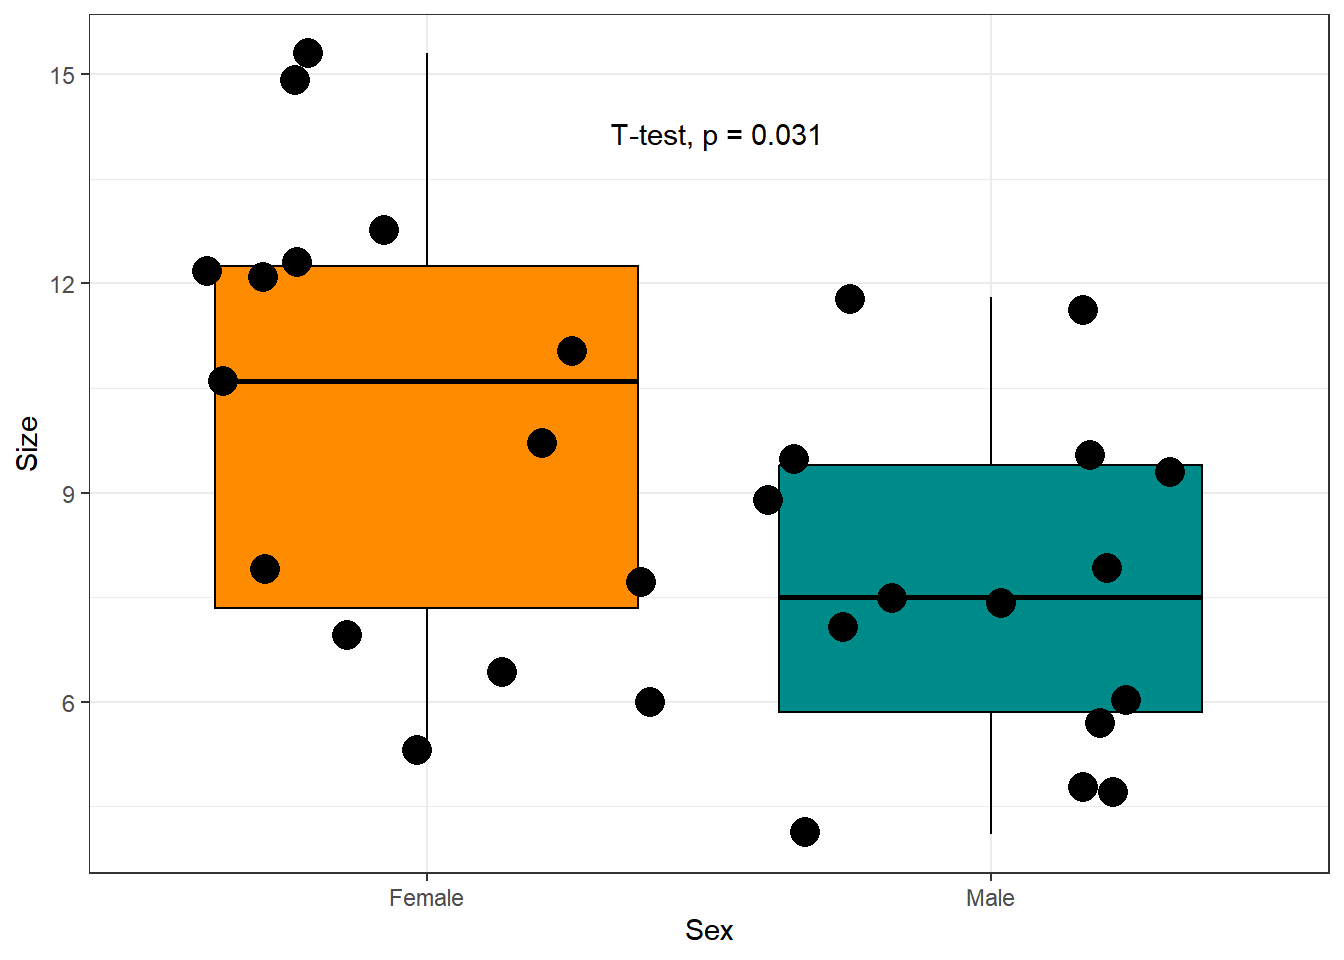
data: Tamanho by Sexo
t = 2.2756, df = 28, p-value = 0.03072
alternative hypothesis: true difference in means between group f and group m is not equal to 0
95 percent confidence interval:
0.2356113 4.4843887
sample estimates:
mean in group f mean in group m
10.08 7.72
spider %>%ggplot(aes(x = Sexo, y = Tamanho, color = Sexo)) +geom_boxplot(fill =c("darkorange", "cyan4"), color ="black") +geom_jitter(shape =16, cex =5, color ="black") +scale_x_discrete(name ="Sex",labels =c("Female", "Male")) +scale_y_continuous(name ="Size" ) +theme_bw() +stat_compare_means(method ="t.test",label.x =1.4,label.y =14)