library(tidyverse)
board_games <- readr::read_csv("https://raw.githubusercontent.com/rfordatascience/tidytuesday/master/data/2019/2019-03-12/board_games.csv")
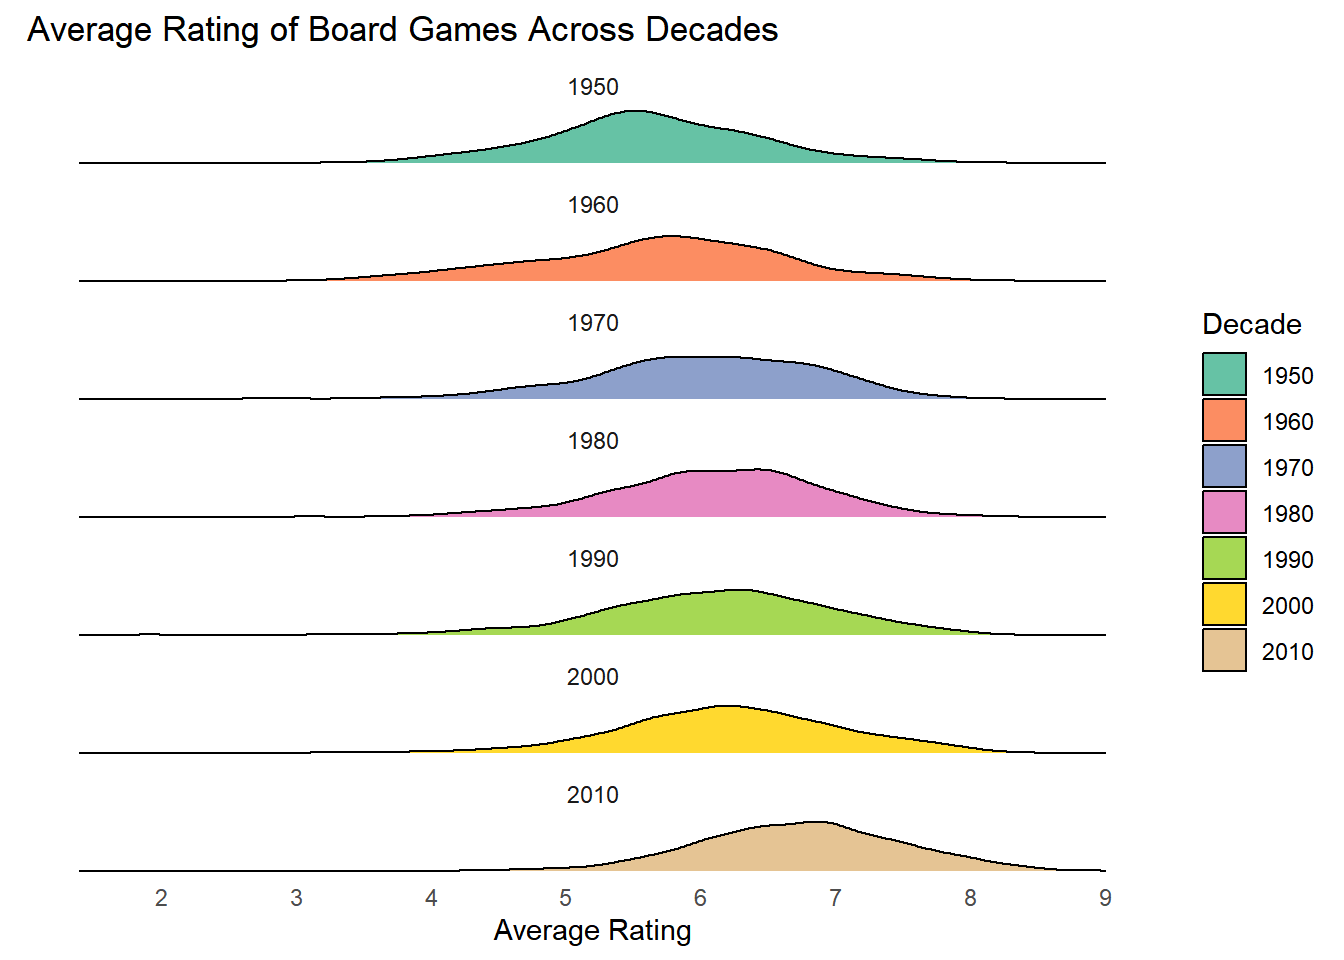
board_games %>%
mutate(
decade = case_when(
year_published >= 1950 & year_published <=1959 ~ 1950,
year_published >= 1960 & year_published <=1969 ~ 1960,
year_published >= 1970 & year_published <=1979 ~ 1970,
year_published >= 1980 & year_published <=1989 ~ 1980,
year_published >= 1990 & year_published <=1999 ~ 1990,
year_published >= 2000 & year_published <=2009 ~ 2000,
year_published >= 2010 & year_published <=2019 ~ 2010,
year_published >= 2020 ~ 2020,
)
) %>%
ggplot(aes(x = average_rating, fill = factor(decade))) +
geom_density() +
scale_y_continuous(
name = element_blank(),
breaks = NULL
) +
scale_x_continuous(
name = "Average Rating",
breaks = c(0:10)
) +
scale_fill_brewer(
name = "Decade",
palette = "Set2"
) +
facet_wrap(~decade, ncol = 1) +
theme_minimal() +
labs(
title = "Average Rating of Board Games Across Decades"
) +
theme(
plot.background = element_blank(),
panel.grid = element_blank()
)